INVESTMENT OPPORTUNITY · CALIFORNIA · PRIVATE–STATE PARTNERSHIP
California: San Jose to Lake Tahoe, starting with 78.3 miles of elevated electric transit from San Jose to Oakland, Vallejo and Fairfield
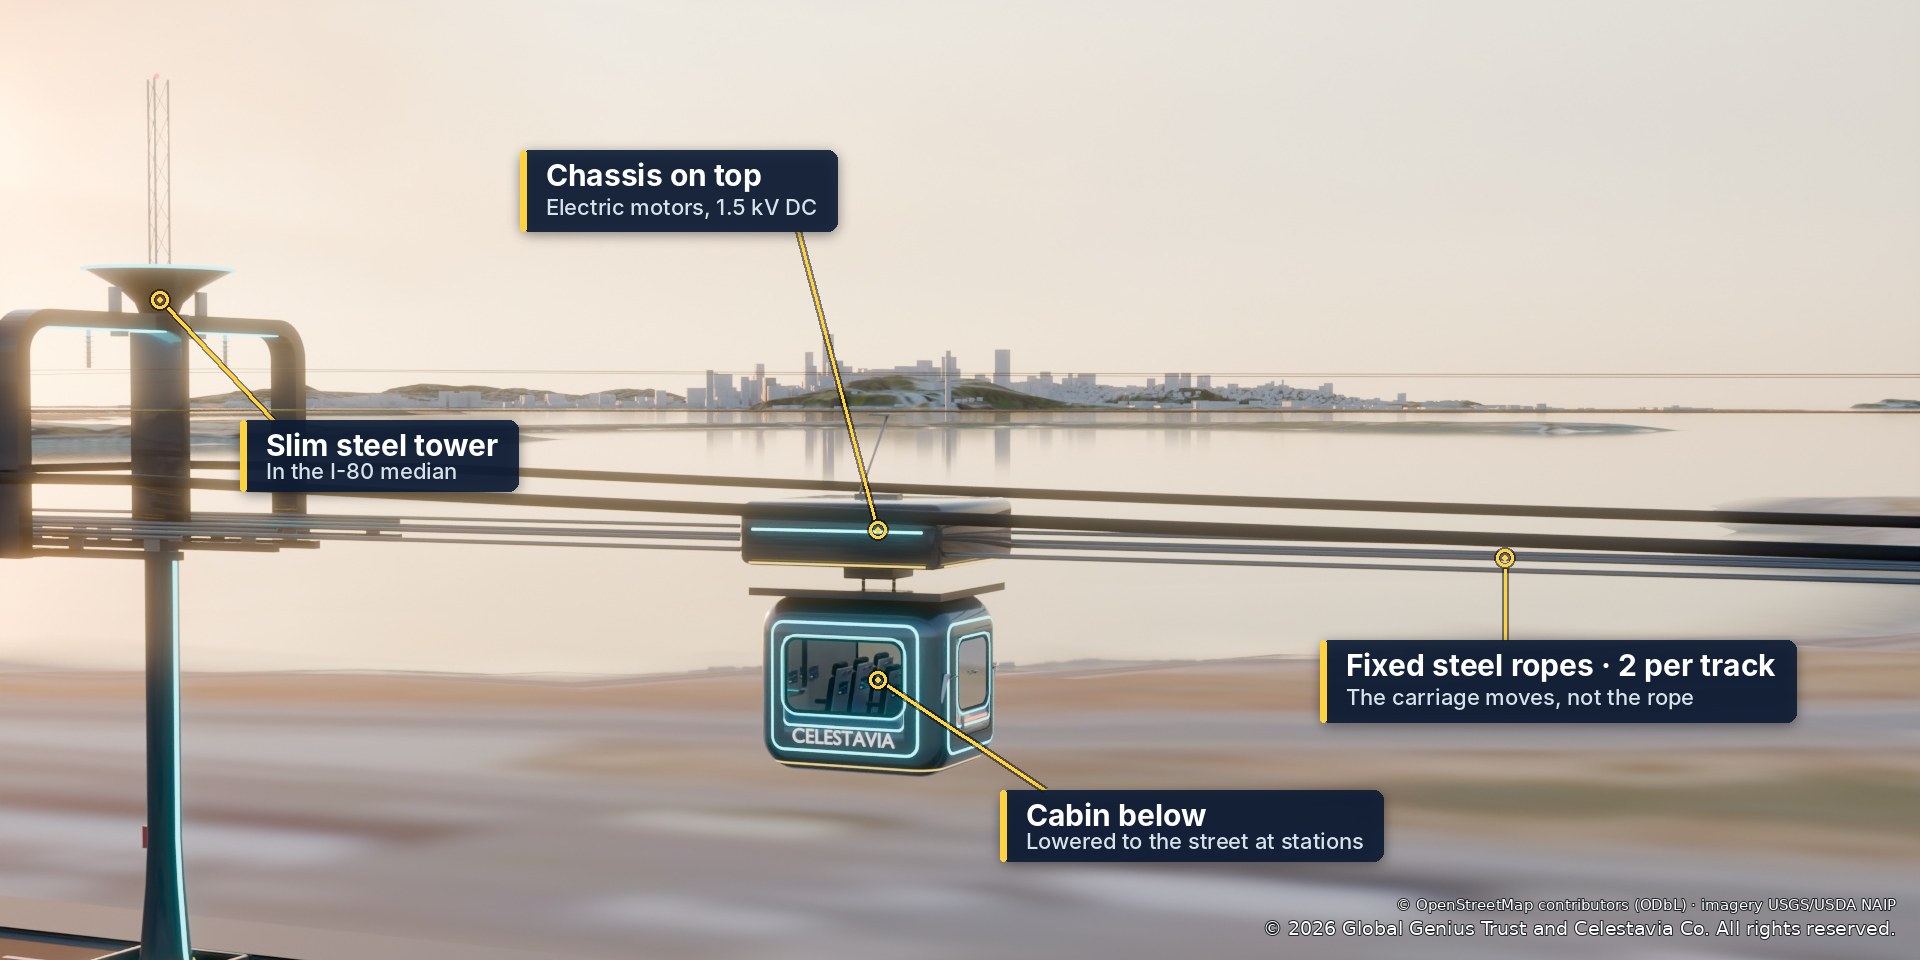
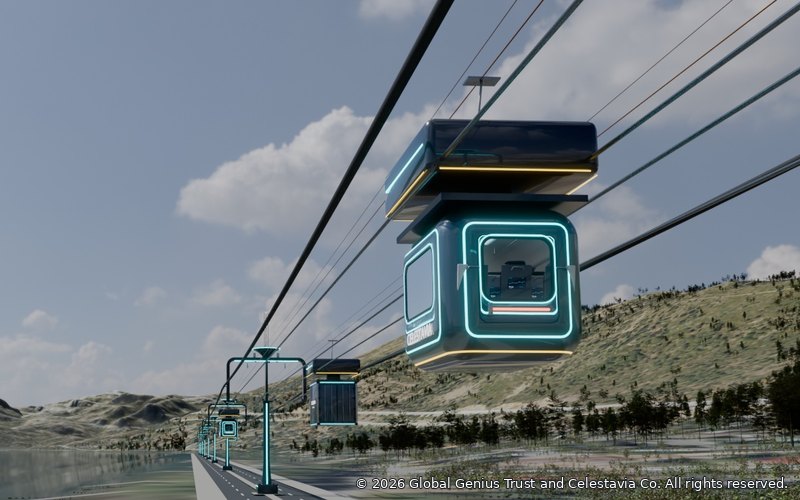
Celestavia is a new elevated transport system: electric chassis drive along fixed steel ropes held by slim towers in the interstate medians of I-880 and I-80, each carrying a cabin below. It runs 24/7 above the traffic, for daily commutes, airport trips and weekend trips to the Sierra. Phase I is privately financed in partnership with the State of California, which contributes the median right of way and the megastation sites.
Celestavia in California
One system for daily commutes, airport trips and the Sierra: our first California proposal links Silicon Valley, the East Bay, Solano County, Sacramento and Lake Tahoe.
Northern California: San Jose – Lake Tahoe
Phase I San Jose – Oakland – Vallejo – Fairfield in the Bay Area; then Davis and Sacramento; then Auburn, Truckee and Lake Tahoe. 230.1 miles in all.
More California proposals coming
Los Angeles and other regions are next. Each proposal starts the same way: its own traffic study, costs per mile and investor case, then a page here.
Northern California on one page
A 78.3-mile Phase I from San Jose through Oakland and Vallejo to Fairfield: 100 stations, about 20.8 million passengers a year, US$ 1.08–1.19–1.31 billion (P10–P50–P90), first service around Aug 2032.
What it is
- An elevated electric transport system: two fixed steel ropes per track, held by slim towers in the I-880 and I-80 medians. The electric chassis with its motors drives along the ropes; the cabin hangs below, separate, and is lowered to the floor at stations. The carriage moves, not the rope; it is not a cable car.
- Cabins run nonstop to the passenger’s station, 24 hours a day. Passengers who book in the app board without waiting; walk-in passengers wait under 8.4 minutes at the busiest station (95th percentile).
- Ride times: San Jose – Oakland about 45 minutes, Fairfield – Oakland about 40; with the full line, San Jose – Sacramento about 2.1 hours and San Jose – Truckee about 3.9 hours, on a ski Friday and in a snowstorm too.
- Beyond passengers: parcels and light cargo, Wi-Fi and 5G on the towers, a fibre backbone, and earthquake, weather, air-quality and wildfire cameras for public agencies.
What the investor gets
- A concession for Phase I in a private–State partnership (P3): private investors finance the works; the State of California is the partner and owner of the concession and the land, and contributes the interstate median right of way and the megastation sites.
- Equity IRR 7.9 % counting 70 % of the projected passengers, with no public payment; minimum DSCR 1.58; payback in about 18 years. 12 % with no public payment once demand reaches 81 % of the projection; 17.2 % at full demand.
- Financing tools that lift the base case: a federal TIFIA or RRIF loan, value capture near the stations and megastation developer partners; or a modest availability payment of about US$ 15–23 M a year for a 12 % return.
- Fares a little above each local reference and indexed to inflation, a California-resident discount with a state ID, a Tahoe leisure premium, private cabins, and every other income stream net of its cost.
- A growth path already costed: Sacramento next (Phase I-B), then the Sierra to Truckee and Lake Tahoe. The full 230.1-mile line earns 9.9 % on 70 % of its passengers.
San Jose to Lake Tahoe, on film
US$ 1.19 bn for Phase I
Phase I costs US$ 1.08–1.19–1.31 billion (P10–P50–P90, 2026 dollars) at California prices with prevailing wages, including the stations, the megastation halls, depots, power supply and the opening fleet of about 727 carriages.
| Group (Phase I, P50) | US$ M per mile | US$ M |
|---|---|---|
| Towers and foundations (seismic, snow) | 1.43 | 112 |
| Ropes | 1.15 | 90 |
| Small stations (incl. pedestrian bridges, access) | 3.15 | 247 |
| Megastations (halls leased; land) | 0.22 | 17 |
| Power (1.5 kV DC contact line, substations, ties, tower batteries) | 1.21 | 94 |
| Systems (signalling, fibre, sensors, snow, control) | 1.16 | 91 |
| Depots and depot land | 1.31 | 103 |
| Vehicles | 0.72 | 57 |
| Soft costs (design/PM/CM, CEQA/NEPA, permits, Caltrans traffic management) | 2.27 | 177 |
| Contingency (maturity allowances) | 1.71 | 134 |
| Own high-voltage feeder on the towers and storage | 0.91 | 71 |
| Total (average of the draws; P50 US$ 1,185 M) | 15.23 | 1,193 |
Average of 20,000 cost draws by group, 2026 dollars. What keeps the cost down: longer spans on the straight interstate medians, stations at existing freeway overcrossings, megastation halls leased from developer partners, small stations sized to their demand (2 or 4 berths), progressive design-build delivery and standard tower families. Carriages and cabins are priced as series automotive parts from contracted makers. Celestavia Co. designs and integrates the technology; towers, carriages, cabins and buildings are contracted to others.
Phase I-B: Davis and Sacramento
Fairfield – Davis – Sacramento adds 36.6 miles for about US$ 0.35 bn more, linking UC Davis, the State Capitol and Sacramento International Airport to the Bay Area (San Jose – Sacramento in all: US$ 1.53 bn, P50).
The full line to Lake Tahoe
San Jose – Sacramento – Auburn – Truckee – Lake Tahoe, 230.1 miles with 9 megastations and 196 small stations: US$ 2.9–3.2–3.5 billion (P10–P50–P90), US$ 13.8 M per mile with stations and 10.8 without.
7.9 % on 70 % of the passengers, 17.2 % on all of them
The base case counts only 70 % of the projected passengers, at Celestavia’s fares, with capex at P50, every income stream net of its cost and no public payment. Each financing tool below lifts it.
Financing options for the partnership
(a) Demand-risk concession
The concessionaire keeps the fares and every other revenue and carries the demand. Equity earns 12 % once passengers reach 81 % of the projection and 17.2 % at full demand. The simplest structure for the State: no annual payment.(b) Availability payment from the State
A fixed, inflation-indexed payment for keeping the line available, about US$ 15–23 M a year, gives investors a 12 % equity IRR on the 70 % case: US$ 15 M with a TIFIA loan and value capture, US$ 23 M without (US$ 33 M at capex P90). Fares then share the upside with the State.(c) Federal credit and partners
A TIFIA or RRIF federal loan for a third of the debt (8.4 % equity IRR), a value-capture district near the stations with the cities and counties (9.1 %), both together 9.5 %; and megastation developer partners who build and lease the halls (rent about US$ 7.4 M a year), keeping the up-front capital low.The State’s share, in kind
The State is the partner and owner of the concession and the land. Its interstate median right of way, megastation sites and surplus depot land are worth about US$ 772 M, some 39 % of the project’s value (range 20–64 % with land values). Private investors finance all the cash. Paid public-service contracts are services, not part of this share.Mature year, investor case (70 % of the passengers, 2026 dollars)
Nominal model, 18-year payback from the notice to proceed; 40-year concession from the notice to proceed; senior debt at 6 %, 30-year tenor, sized at a 1.35 coverage, up to 65 % gearing; California and federal taxes. Fares, payments and opex are indexed to inflation each year.
A Bay Area commute that holds its time, and the Sierra without chain control
In our traffic model the morning and evening peaks on I-880 and I-80 are saturated. Celestavia’s value is a reliable time every day, work time on board and a trip to the mountains that does not depend on the weather on the road.
Our corridor traffic model of I-880, I-80 and SR-267 (24 hours, both directions, calibrated to traffic counts and typical peak times) moves about 20.8 million passengers a year onto Phase I, and 29.7 million onto the full line, from cars, buses and trains, every day of the week and at night: commuters, airport passengers (SJC, OAK and, with Phase I-B, SMF), students, visitors and weekend trips to Tahoe.
Fares: a little above each local reference, indexed to inflation
| Trip | Celestavia fare | California resident (25 % off) | Car, full cost per person |
|---|---|---|---|
| Short city hop (2 mi, e.g. Diridon – SJC) | US$ 3.75 | US$ 2.81 | US$ 9.28 |
| Fairfield – Oakland (37 mi) | US$ 20.65 | US$ 15.49 | US$ 32.29 |
| Davis – Sacramento (12 mi) | US$ 9.40 | US$ 7.05 | US$ 19.79 |
| San Jose – Sacramento (115 mi) | US$ 59.04 | US$ 44.28 | US$ 65.68 |
| San Jose – Truckee (218 mi) | US$ 166.71 | US$ 125.03 | US$ 126.24 |
Short trips sit between the bus and a rideshare, commutes between the train and the full cost of the car, long trips like a plane ticket, with a leisure premium on the Tahoe routes. California residents get the discount with a state ID; visitors pay the full fare; monthly passes for commuters; private cabins for groups who prefer not to share (about 8 in 100 bookings at 3.5 times a single fare).
Long trips as an experience (options)
On board
- Catered, ready-to-eat meals ordered ahead in the app and delivered to the cabin before departure.
- The long-trip cabin with its own restroom for rides over an hour.
- Luxury cabins for 2 to 4 passengers, with a bar and finer food and service.
- Group convoys: a family, a team or a company travelling together in cabins that run one after the other.
Stopovers on the same ticket
On the Bay Area – Tahoe trip, passengers are welcome to stop at a station along the way for dinner, a winery or an evening with friends, or a night in a hotel, and continue later or the next day on the same ticket. Restaurants, shops and hotels at and around the megastations earn from it, and so does the line.
What California gains
Time and reliability
Commuters get the same door-to-door time every day and can work on board; drivers who stay on I-80 and I-880 get faster peaks. Ski and storm Fridays to Truckee take hours less than by car.Earthquakes
The Bay Area has a 72 % chance of a magnitude 6.7 or larger earthquake in 2014–2043 (USGS UCERF3, 2015). Flexible ropes on towers placed off the fault traces, deep foundations in Bay mud and seismic sensors that stop the cabins within seconds of an early warning.Wildfire and power shutoffs
Steel towers on cleared pads with no fuel below; the line’s own high-voltage feeder and storage options ride through utility public-safety power shutoffs, and every tower keeps 21 days of battery for its sensors, wildfire cameras and 5G. The line can serve as an extra evacuation route for Truckee and North Tahoe.Donner snow
Donner Pass gets about 30 feet of snow in an average winter (UC Berkeley Central Sierra Snow Laboratory, 1991–2020). Ropes ride above the drifts, with de-icing units and covered stowage; on our storm day the line keeps running at reduced speed while I-80 is under chain control.Carriages and cabins are built by contracted vehicle makers, so their factory jobs come on top of the figures above. The goal is zero accidents on the line.
Cost per mile against California’s other rail projects
| Project | Cost | Miles | US$ M per mile | Source (year) |
|---|---|---|---|---|
| Celestavia Phase I, San Jose – Fairfield (elevated, 4 tracks, 100 stations) | US$ 1.19 bn | 78.3 | 15.1 (10.6 line only) | This study (2026), P50 to opening |
| Celestavia full line, San Jose – Lake Tahoe | US$ 3.2 bn | 230.1 | 13.8 | This study (2026) |
| California High-Speed Rail, Phase 1 San Francisco – Los Angeles / Anaheim | US$ 126 bn | 494 | ~256 | CHSRA Draft 2026 Business Plan (Feb 2026) |
| Brightline West, Las Vegas – Rancho Cucamonga (I-15 median) | US$ 21.5 bn | 218 | ~99 | US DOT loan listing (Oct 2025) |
| BART Silicon Valley Phase II, Berryessa – Santa Clara (mostly tunnel) | US$ 12.1–12.7 bn | ~6 | ~2,000–2,100 | VTA (Dec 2025); Santa Clara County Civil Grand Jury (2025–26) |
| Capitol Corridor, San Jose – Oakland – Sacramento – Auburn (Amtrak) | — | ~168 | — | Runs on Union Pacific freight track; 1.14 million passengers in FFY 2025 (CCJPA, Amtrak 2025) |
Each project has a different scope, speed and tunnel share; the table compares capital cost per mile only. Celestavia runs at up to 90 km/h (56 mph), nonstop to the passenger’s station.
First service around Aug 2032
Phase 0 from 2027 (environmental review under CEQA and NEPA, Caltrans agreements for the medians, the CPUC safety certification, the P3 award and design); notice to proceed around Oct 2030; about 31 months of works; first service around Aug 2032 (P10–P90 Oct 2031–Jul 2033) and all of Phase I around May 2033.
- Phase 0 (2027–Oct 2030): partnership agreement with the State, the investor consortium and the federal credit application; environmental review; design and certification.
- Phase I (to May 2033): San Jose – Oakland – Vallejo – Fairfield, opening section by section.
- Phase I-B: Fairfield – Davis – Sacramento.
- Phase II: Sacramento – Auburn – Tahoe National Forest – Truckee – Lake Tahoe (Kings Beach), with Incline Village next.
Three phases, one line from San Jose to Lake Tahoe
| Phase | Route | Miles | Investment (P50 unless shown) |
|---|---|---|---|
| I | San Jose – North Oakland – Vallejo – Fairfield; megastations at all four | 78.3 | US$ 1.08–1.19–1.31 billion (P10–P50–P90) |
| I-B | Fairfield – Davis – Sacramento | 36.6 | about US$ 0.35 bn more |
| II | Sacramento – Auburn – Tahoe National Forest – Truckee – Lake Tahoe (Kings Beach); Incline Village next | 115.2 | full line US$ 2.9–3.2–3.5 billion |
The technology, for the technical team
Two parts: the electric chassis on top, with its motors, drives along fixed steel ropes; the cabin below is separate and is lowered to the floor at stations.
The system
Each track has two large fixed steel ropes, held by slim towers in the interstate medians; Phase I opens with 4 tracks (2 each way) on towers ready for 8. The chassis drives along the ropes on 1.5 kV DC with one motor per wheel pair, each with its own controller, and regenerative braking returns energy to the line. Its standard top speed is 90 km/h (56 mph); each carries a 9-seat cabin, a long-trip cabin with a restroom, a private or luxury cabin, or a light-cargo box. A battery in a fireproof case with its own fire suppression takes every carriage to the next station. The goal is zero accidents.
Stations and megastations
Phase I has 96 small stations, at least one per kilometre in the cities, most of them at existing freeway overcrossings so passengers walk across the bridge to the median, and 4 megastations: San Jose, North Oakland (MacArthur Maze), Vallejo and Fairfield. Small stations have 2 or 4 berths where the cabin is lowered to the floor; megastations add park-and-ride, EV charging, last-mile vehicles, shops and restaurants, and can carry homes or a hotel above, built with developer partners. Parcel lockers and a waste box at every station.
Signalling and capacity
Carriages run under moving-block signalling, each following the one ahead at its own braking distance plus a margin. On the straight median the design basis is one loaded carriage per span per track, which lets the towers stand 120–135 m apart (85 m on curves) and still carries the peak with a 25 % margin; Phase I needs about 1,040 towers. The rule comes with its own safety case for the CPUC.
Power
1.5 kV DC traction on every track, about 40 MW at the weekday peak for Phase I. The line carries its own high-voltage feeder on the towers (about US$ 64 M, in the cost), stepped down at its substations, so it does not depend on local feeders that may be shut off in fire weather. Every tower has a battery for at least 21 days of sensors, cameras and 5G.
Hazards and design answers
- Earthquakes (Hayward, Calaveras and Green Valley faults): towers off the fault traces, deep foundations in Bay mud, earthquake early warning (USGS ShakeAlert, statewide since 2019) and tower sensors that stop the cabins; flexible ropes, no rigid deck. The 1989 Loma Prieta earthquake collapsed the I-880 Cypress viaduct in West Oakland, with 42 deaths (USGS).
- Sea level and Bay shoreline: tower footings above projected high water along the I-880 and I-80 Eastshore lowlands (BCDC Adapting to Rising Tides maps).
- Floods and atmospheric rivers: rivers crossed bank to bank; on Phase I-B the Yolo Bypass is crossed on piles above the 200-year flood level.
- Heat: ropes and contact line sized for heat waves, air-conditioned cabins, shaded stations. Sacramento reached 116 °F on 6 September 2022, its all-time record (National Weather Service).
- Sierra snow, wind and wildfire (Phase II): snow-load design above 6,000 ft, de-icing units, departures held by forecast in the strongest ridge winds, cleared tower pads.
How the numbers were made
- Route: the study alignment along I-880 and I-80 (San Jose – Lake Tahoe at Kings Beach, 230.1 miles), before survey; stations by the rule of at least one per kilometre in populated areas.
- Traffic and demand: a 24-hour corridor traffic model of I-880, I-80 and SR-267 calibrated to traffic counts and typical peak times, with mode choice from today’s trips; eight city networks around the line; weekday, ski-Friday and storm-Friday days.
- Capacity: station queues at the peak (walk-in and app passengers), cabins and carriages needed, energy and substations.
- Cost: 20,000 cost draws per scope at California prices with prevailing wages; per mile with and without stations computed per draw; the opening fleet sized for the investor demand and grown as passengers come.
- Investor model: a 40-year nominal concession model with debt sized on coverage, California and federal taxes, inflation indexing, every income stream net of its cost, and the investor case at 70 % of the projected passengers.
- Schedule: 20,000 schedule draws for Phase 0 and the works.
Public sources: California High-Speed Rail Authority, Draft 2026 Business Plan (Feb 2026); US DOT Build America Bureau loan listing for Brightline West (Oct 2025); VTA, BART Silicon Valley Phase II (Dec 2025) and Santa Clara County Civil Grand Jury report (2025–26); Capitol Corridor Joint Powers Authority and Amtrak FY25 passenger figures (Nov 2025); USGS UCERF3 earthquake forecast (2015) and Loma Prieta records; UC Berkeley Central Sierra Snow Laboratory (1991–2020 normals); National Weather Service Sacramento (2022); BCDC Adapting to Rising Tides; California DIR prevailing wage determinations (2025–26); USDOT Benefit-Cost Analysis Guidance; US Census 2020.
Projections, not guarantees. Costs are ranges until suppliers quote.
Contact
For investors, infrastructure funds, lenders and public partners: write to us to receive the full Northern California study and the Phase I financial model.
Join us
Join Celestavia
Public authorities, transport operators, business people and the general public are invited to learn about the proposal, share their ideas and join in. Sign up and we will keep you posted on the project.